Working with vector and matrices
In this notebook, we show some of the most useful features of the tensor module. The module contains abstractions to work with coherent collections of objects, like vectors. We will focus on vectors of timeseries, but the same applies to grid data.
As an example, we will work with same fake horizon centroid data.
(This notebook is meant to be converted in Sphinx documentation and not used directly.)
[1]:
import matplotlib.pyplot as plt
import numpy as np
from kuibit.timeseries import TimeSeries
from kuibit.tensor import Vector

%matplotlib inline
[2]:
# First, we generate the data. We will focus on the XY plane.

# This is an outspiral
t = np.linspace(0, 20, 5000)
x1 = t * np.sin(t)
y1 = t * np.cos(t)
x2 = -t * np.sin(t)
y2 = -t * np.cos(t)

bh1 = Vector([TimeSeries(t, x1), TimeSeries(t, y1)])
bh2 = Vector([TimeSeries(t, x2), TimeSeries(t, y2)])
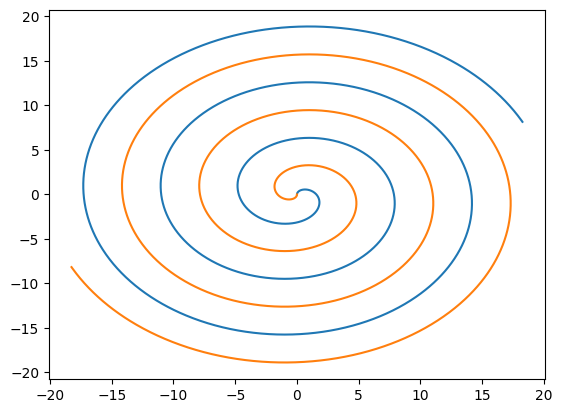
bh1 and bh2 are Vectors of TimeSeries. Let’s plot them.
[3]:
plt.plot(*bh1)  # Example of unpacking the vector into the two components
plt.plot(bh2[0], bh2[1])
[3]:
[<matplotlib.lines.Line2D at 0x7f474af74e10>]

Vectors behave like mathematical vectors: we can evaluate them, or perform algebraic operations.
[4]:
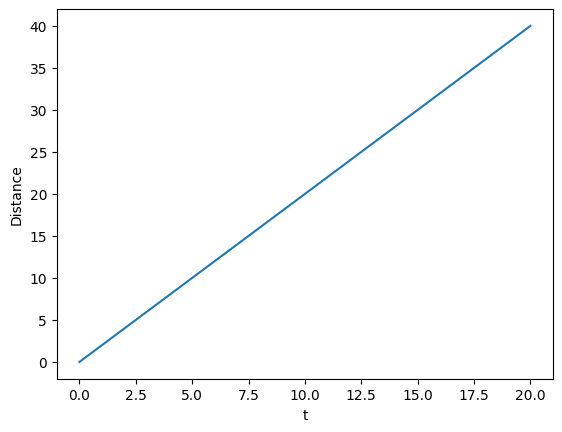
distance_vector = abs(bh1 - bh2)
print(f"Distance vector at t = 2 {distance_vector(2)}")

# We can also get the magnitude of the distance as a function of time
plt.plot(distance_vector.norm())
# distance_vector.norm() is a TimeSeries
plt.xlabel("t")
plt.ylabel("Distance")
Distance vector at t = 2 [3.63718971 1.66458735]
[4]:
Text(0, 0.5, 'Distance')

Vectors inherit all the methods from the contained object. In this case, TimeSeries, so we can call methods like differentiated to take the time derivative.
[5]:
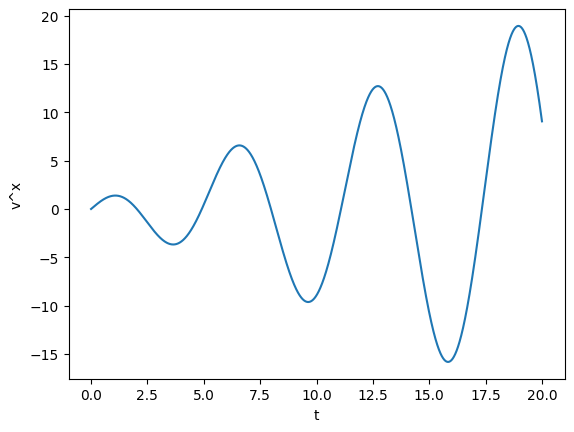
velocity1 = bh1.differentiated()

# velocity1 is a Vector with the time derivatives
# plotting the first component, along the x axis
plt.plot(velocity1[0])
plt.xlabel("t")
plt.ylabel("v^x")
[5]:
Text(0, 0.5, 'v^x')

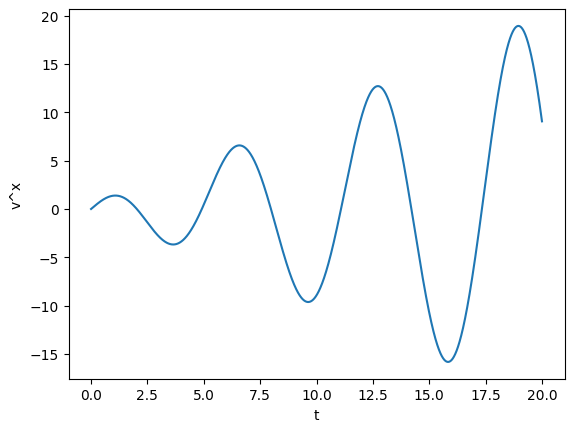
Methods that edit the object in place work too, so we could have taken the derivative with differentiate.
[6]:
bh1.differentiate()

plt.plot(bh1[0])
plt.xlabel("t")
plt.ylabel("v^x")
[6]:
Text(0, 0.5, 'v^x')

IN this notebook, we looked at Vector. Matrix objects behave similarly. Both Vector and Matrix share infrastructure with the general Tensor class, which, at the moment, implements basic features to work with tensors of generic rank.
